Pages

Wednesday, October 10, 2012

Size matters

Ever since watching Floyd Lavery race sockless, I've always wondered how much the weight of socks matter to race performance. Haven't you? Today I read an article on the NYT blog (it's an old article) on the energetics of shod v. barefoot running and I didn't really care about the point of the article (barefoot is more expensive because we use active muscle to dampen contact forces which shoes do in shod running) but I zeroed in on the statement that an additional 100g of shoe adds about 1% VdotO2 to run at same speed. To determine how weight affects race performance I used an online running calculator that gave me the estimated VdotO2 for a given race performance. Here is what I found


10K time    VdotO2   %larger than VdotO2 @ 37 min 10K
37:00.0     52.26
36:55.0     52.4     0.27
36:50.0     52.55    0.55
36:45.0     52.69    0.82
36:40.0     52.84    1.11
36:35.0     52.99    1.40
36:30.0     53.14    1.68
36.25.0     53.29    1.97


I don't know if that's 100g in total shoe or per shoe. Let's say its total shoe. This means the difference in wearing say Asics Piranhas (122g) v. Saucony Kinvara (224g) is about 200g or 2% VdotO2 or about 35s over 10K assuming all else equal of course (like how much muscle work is being used to dampen impact forces). Thats about 1s/mile/oz/shoe. If its 1% per 100g per shoe then the difference would be only 17s. That's significant enough to me to wear Asics Piranhas (I do) or the Inov8 155s (I do that to). This doesn't mean I would advise you to wear Asics Piranhas or Inov8 155s  for a marathon because I'm guessing there would be variables other than weight (and having to do with dampening of impact forces) that would affect performance.

OK what about socks. Its hard to find the weight of socks but a pair of swiftwick aspire zeros weighs 23g for the pair. That's about an expected 0.23% difference in performance, or something just less than 5s according to the chart above. That's not very much and probably not worth the consideration. But then maybe you wear a heavier sock?

What about a pair of "performance enhancing compression socks"? I can't find how much these weigh. Plus the penalty in VdotO2 won't be exactly correct because lots of that weight is closer to the center of rotation. And then I'm not sure about the "everything else equal" assumption with compression socks since they are at least advertised to enhance performance because of the compression.

PS - well I just googled around and found the source. Confirms what I've written and fills in some unknowns as well.

Sunday, September 16, 2012

Trail to Ale


Today was a perfectly stunning day to race. 36:57 10K PR. Greatly aided by 1) perfect racing weather, 2) net downhill, and 3) an uncertified course that was maybe a tad short : )?  It was also a cut-back week, so I was fresher than for the bruiser.

It was fun regrouping with Jeremy and Brett, at least for mile 1. Brett took off fast and quickly got a jump on Jeremy and me. About 3/4 mile in, a biggish group (maybe 10 runners, including Brett) with mixed abilities (from 35:30 to 37:30) was still together and I told Jeremy to not let that group get away. Jeremy quickly bridged the gap while I stayed in their wake. One gradual and one crazy downhill took us down to the Bayside trail and a 5:45 first mile. From there we ran to Tukey's bridge and did Back Cove clockwise. The big group slowly stretched out and I started to slowly reel in a few racers. Jeremy and Brett gained no extra space on me from mile 1 to maybe mile 4 or so. Somewhere between mile 4 or 5, Jeremy found another gear and started to stretch it out. I made essentially no progress on Brett until the climb to Tukey's bridge. From here I got within shooting distance. We turned onto the Eastern Prom Trail and I made a big push to catch and pass Brett at the top of the climb at the water treatment plant. We had about 1/2 mile left. Brett raced the Lobsterman Tri yesterday so I thought he was cooked. Actually, it was me who was cooked in pushing to catch Brett. I was in full gnu mode. Brett tucked in my wake for a few hundred meters than gunned it home with me hopelessly trying to keep up.

I won't take the PR too seriously since the course was not certified. But I'm happy with the result because I beat a few folks who torched me at B2B and that's what racing is really about. And even if the course was short, my watch-pace was 1s/mile faster than my PR pace from B2B in 2010.


A common site at road races the past 2 years - me 3-4s behind Brett

Monday, September 10, 2012

Bruiser Report

Perfect racing weather and conditions for a race like this. I jumped out at what I thought was a fast pace and traded pulling with Jeremy, James, and Brett Hellstedt through the first four miles. Just before bat cave I lost contact with that gang and that was it. Nice racing boys! If you want to read about real racing, read Jeremy's fantastic post. After I lost contact, I wasn't really racing anyone but thought I was running at my maximum sustainable pace. I was alone through bat cave, the remainder of Fox East, and the lower half of the snomo trail back to the top of the course but on the upper half of the snowmo trail, Gabe Flanders became visible in my rearview mirror. I found another gear (or maybe 1/2 gear) and kept him at bay until the O trail. At the O trail I let him by with the goal to have him pull me through faster than I could him. He drifted away very quickly but was always in sight, although it was impossible on that trail to figure out what the gap was. He finished 1:10 ahead of me. Wow. About 1/2 way through I became keenly aware that George and Morgan Laidlaw were in sight behind me and seemed to be catching up. They didn't but they closed the gap to about 35s.

So my O-trail was slow. Jeremy's statement that he entered the O-trail at 1:11:xx is just flogging a dead horse. I entered at 1:13:32 so at most I entered 2:20 back but finished the race 3:27 back so lost at least 1:17 to Jeremy in there. Clearly my O-trail running is slow, which maybe shouldn't surprise since I have zero acceleration skillz.

Here are my segment splits compared to 2010, the last time I raced the bruiser (and the O trail)

Segment2010 2012 Seg Diff % diff
start + Lanzo 0:02:57 0:03:04 0:00:07 3.95
Island 0:13:52 0:14:17 0:00:18 2.75
Ragan + Ginn West 0:24:58 0:25:48 0:00:25 3.75
Ginn East 0:36:28 0:37:50 0:00:32 4.64
Bat Cave 0:42:09 0:43:54 0:00:23 6.74
Fox East 0:47:16 0:49:25 0:00:24 7.82
Snomo 0:53:41 0:56:07 0:00:17 4.42
Ginn/Fox West 1:05:40 1:08:27 0:00:21 2.92
Uphill to O trail 1:10:45 1:13:32 0:00:00 0.00
O trail 1:32:13 1:35:55 0:00:55 4.27
Finish runout 1:33:01 1:36:34 0:00:09 -11.36


I'm very surprised that the first few segments were slower than 2010 because my watch was telling me these were faster. Never believe a gps watch on a twisty single track trail (note this criticism doesn't affect my segment times since these can be found very accurately on the map). My slowest segments were in the middle when I was racing all alone. Interesting.

It felt good to get out and do a long trail race. For many reasons, that was my first trail race of the season (I'm not counting the Pineland 10K). I'm happy with the effort, if not the results. That said, the race absolutely destroyed my foot (the retrocalcaneal bursitis that I've had since March).

Saturday, September 8, 2012

Cruisin' for a Bruisin'


Since the B2B, this has been my buildup for USATF NE XC championship race in November. Rolling 7 day average of 66 miles, which is a lot for me (>30% more than my summer mileage). This is all in singles and only 2 runs were logged as "long", so it's mostly 9-10 milers. My recovery days have been about 1 hour runs at a really slow pace. The red runs include segments from a little faster than MP (about 6:35) to a little slower than MP (about 7:00) or the equivalent effort if on trail (estimated by HR). Only one fast day in there and that was a 5K race. The goal is to keep up this mileage through October AND add 1 day per week of faster interval type work, which will probably be at Twin Brook on Wednesdays. Early interval stuff will be 5K-10K pace with long recoveries. Later intervals will start to target my 8K pace and the recoveries will get shorter as November approaches. That's the plan at least.

Tuesday, September 4, 2012

Thursday, August 23, 2012

Am I slower or are summers hotter?

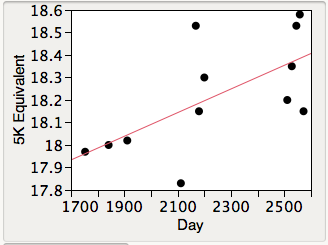
Fig. 1. I am getting slower! These are my 5K equivalent times for all races 5K to 10K distance over the last three years. For the 8K, 5M, and 10K times I used McMillan to estimate the 5K equivalent time. Day is simply number of days since a race in 2005, so you can see the 2010, 2011 and 2012 clusters. The correlation here is .65 Also notice that race times get worse through each season. You cannot tell this from the graph but my 2010 summer races were especially cool (at least B2B). This suggests...


Fig. 2 Dew Point matters! This is a pretty stunning, given all the other factors that can effect race performance including especially point in training cycle and freshness (no, mild, or full taper). The linear correlation is .81. I would expect the relationship to actually be quadratic (green line) as dew point should have little effect when low but dramatic effect when high. The quadratic component is not significant statistically but shouldn't be rejected using a model selection approach. This summer's B2B was super high dew point and I also ran a 5K in Florida. By contrast in 2010, my only 5K was in early spring and the B2B was beautifully cool and dry. This suggests...

Fig 3. GLOBAL WARMING!!!! Not really, but this is even more stunning because this very high correlation (.77) is completely coincidental. I happened to run early spring races in 2010 and 2011 and summer race days were mild in 2010, hot in 2011 and even hotter in 2012. This suggests that maybe my slowdown (Fig. 1) is only apparent and that actually what is happening is that I've been simply racing in hotter weather. This suggests...

Fig. 4. I'm not slowing! The Y axis is my 5K equivalent times corrected for dew point. That is, I used the residuals of the Times v. Dew Point regression and plotted these against Day. Voila! To verify this, I used a simple multiple regression with Dew Point (and DP^2) and Day in the model. Day explains very, very little variation above and beyond Dew Point.

Conclusion: What appears like a very clear slow down over the past 3 year is really due to the differences in the timing of my races between 2010, 2011, and 2012 AND warmer, more humid 2011 and especially 2012 compared to 2010. Sadly though, I'm not getting faster either. 

file under: how to lie with statistics