
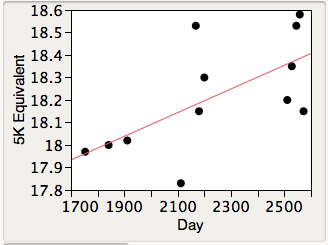
Fig. 1. I am getting slower! These are my 5K equivalent times for all races 5K to 10K distance over the last three years. For the 8K, 5M, and 10K times I used McMillan to estimate the 5K equivalent time. Day is simply number of days since a race in 2005, so you can see the 2010, 2011 and 2012 clusters. The correlation here is .65 Also notice that race times get worse through each season. You cannot tell this from the graph but my 2010 summer races were especially cool (at least B2B). This suggests...

Fig. 2 Dew Point matters! This is a pretty stunning, given all the other factors that can effect race performance including especially point in training cycle and freshness (no, mild, or full taper). The linear correlation is .81. I would expect the relationship to actually be quadratic (green line) as dew point should have little effect when low but dramatic effect when high. The quadratic component is not significant statistically but shouldn't be rejected using a model selection approach. This summer's B2B was super high dew point and I also ran a 5K in Florida. By contrast in 2010, my only 5K was in early spring and the B2B was beautifully cool and dry. This suggests...

Fig 3. GLOBAL WARMING!!!! Not really, but this is even more stunning because this very high correlation (.77) is completely coincidental. I happened to run early spring races in 2010 and 2011 and summer race days were mild in 2010, hot in 2011 and even hotter in 2012. This suggests that maybe my slowdown (Fig. 1) is only apparent and that actually what is happening is that I've been simply racing in hotter weather. This suggests...

Fig. 4. I'm not slowing! The Y axis is my 5K equivalent times corrected for dew point. That is, I used the residuals of the Times v. Dew Point regression and plotted these against Day. Voila! To verify this, I used a simple multiple regression with Dew Point (and DP^2) and Day in the model. Day explains very, very little variation above and beyond Dew Point.
Conclusion: What appears like a very clear slow down over the past 3 year is really due to the differences in the timing of my races between 2010, 2011, and 2012 AND warmer, more humid 2011 and especially 2012 compared to 2010. Sadly though, I'm not getting faster either.
file under: how to lie with statistics